This new post explores what Grants/Proposal Writers are paid as compensation in terms of median salaries in major cities in all 50 states and in the nation’s capital. It presents data for mid-2019. Other posts for 2019 will explore hourly rates and flat fees, retainer fees, review and revision fees, and other aspects of the compensation of writers of grant proposals. All data will be for the United States of America.
Median Salaries for Grants/Proposal Writers
What Grants/Proposal Writers earn reflects many factors. Among them are years of experience, level of educational attainment, geographic location, and the nature of the employer.
As of mid 2019, Salary.com has reported that the median annual salary for “Grants/Proposal Writers” in 51 cities was $68,629. The middle 20 cities selected for exploration earned medians from $65,714 to $72,210; the bottom 10 selected cities earned medians of $65,159 or less; and the top 10 selected cities earned medians of $73,797 or more. Base salaries represented about 70% of total compensation; the other 30% of total compensation were fringe benefits and bonuses.
Calculated on a full 52-week year, the same median annual salary worked out to $1,319.79 per week, and the range for the 51 cities’ medians was $1,105.50 to $1,611.63 per week. Calculated over a 2,080-hour work-year, the same national median annual salary worked out to $32.99 per hour, and the range for the 51 cities became from $27.64 per hour to $40.29 per hour. The highest median salary was 145.8% of the lowest median salary.
Median Salaries By Selected Cities
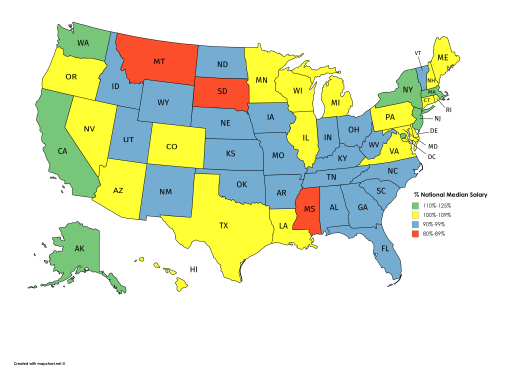
As of mid 2019, “median annual salaries” in 51 selected cities searched on Salary.com ranged from $57,486 in Pierre, SD to $83,805 in New York City, NY. In mid 2019, 21 of the medians for the 51 cities fell in the range of $65,000 to $70,000.
| Median Annual Salaries — 2019 Data Comparisons | ||
| Salary.com Data | As % of 2019 Median for 51 Cities | |
| Median | $68,629 | 100.00% |
| New England States | ||
| Hartford CT | $74,907 | 109.15% |
| Portland, ME | $69,191 | 100.82% |
| Boston, MA | $78,783 | 114.80% |
| Manchester, NH | $73,139 | 106.57% |
| Providence, RI | $73,346 | 106.87% |
| Burlington, VT | $68,360 | 99.61% |
| Mid-Atlantic States | ||
| Dover, DE | $73,797 | 107.53% |
| Washington, DC | $77,038 | 112.25% |
| Baltimore, MD | $71,199 | 103.74% |
| Newark, NJ | $79,095 | 115.25% |
| New York, NY | $83,805 | 122.11% |
| Philadelphia, PA | $74,524 | 108.59% |
| Charleston, WV | $63,089 | 91.93% |
| Midwestern States | ||
| Chicago, IL | $73,777 | 107.50% |
| Indianapolis, IN | $67,342 | 98.12% |
| Louisville, KY | $65,312 | 95.17% |
| Detroit, MI | $70,964 | 103.40% |
| Columbus, OH | $68,325 | 99.56% |
| Great Plains States | ||
| Des Moines, IA | $66,559 | 96.98% |
| Kansas City, KS | $68,078 | 99.20% |
| Minneapolis, MN | $73,762 | 107.48% |
| St. Louis, MO | $68,193 | 99.36% |
| Lincoln, NE | $65,042 | 94.77% |
| Bismarck, ND | $64,557 | 94.07% |
| Pierre, SD | $57,486 | 83.76% |
| Milwaukee, WI | $68,664 | 100.05% |
| Northwestern States | ||
| Anchorage, AK | $77,947 | 113.58% |
| Boise, ID | $65,714 | 95.75% |
| Great Falls, MT | $60,048 | 87.50% |
| Portland, OR | $72,391 | 105.48% |
| Seattle, WA | $76,002 | 110.74% |
| Casper, WY | $64,523 | 94.02% |
| Southeastern States | ||
| Birmingham, AL | $65,159 | 94.94% |
| Little Rock, AR | $64,372 | 93.80% |
| Jacksonville, FL | $66,458 | 96.84% |
| Atlanta, GA | $68,214 | 99.40% |
| New Orleans, LA | $68,757 | 100.19% |
| Jackson, MS | $61,634 | 89.81% |
| Charlotte, NC | $67,846 | 98.86% |
| Charleston, SC | $65,370 | 95.25% |
| Nashville, TN | $64,183 | 93.52% |
| Richmond, VA | $69,434 | 101.17% |
| Southwestern States | ||
| Phoenix, AZ | $68,629 | 100.00% |
| Los Angeles, CA | $78,332 | 114.14% |
| Denver, CO | $70,043 | 102.06% |
| Honolulu, HI | $72,210 | 105.22% |
| Las Vegas, NV | $72,030 | 104.96% |
| Albuquerque, NM | $64,689 | 94.26% |
| Okla. City, OK | $65,679 | 95.70% |
| Houston, TX | $70,992 | 103.44% |
| Salt Lake City, UT | $65,690 | 95.72% |
As in previous years, the median annual salaries in mid 2019 were no more uniform within most states than they were around the country. Out of the 51 cities examined here, only 11 were within $1,000 (plus or minus) of the national median (for the selected cities).